The Hidden Architecture of Modern Markets
The Algo in the Room: How Algorithmic Trading Shapes the Markets You Trade In
Algorithms now execute the majority of trades on every major exchange — understanding what they are doing, and why, is no longer optional for any serious retail trader.

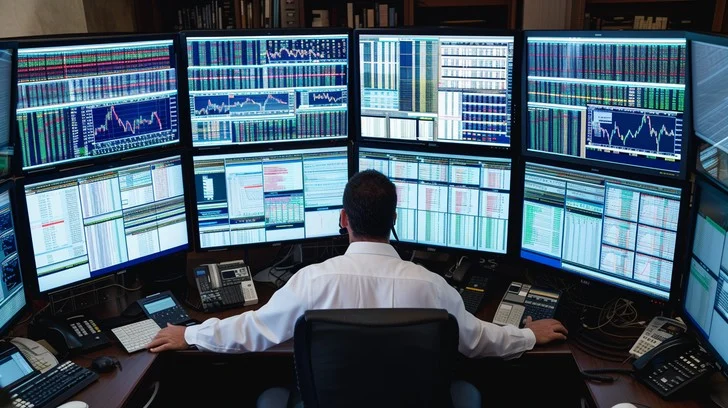
Every time you place a market order on a FTSE-listed stock, the moment your order touches the exchange, it enters an environment that is almost entirely governed by machines. They are not acting on instinct, reading the news, or worrying about their pension. They are executing pre-programmed instructions at speeds that make human reaction times irrelevant — measuring their latency in microseconds and their profits in fractions of a penny, multiplied millions of times across millions of trades each day. They are algorithmic trading systems, and they have quietly become the defining feature of how modern equity markets actually work.
This is not a conspiracy. It is not a secret. It is simply the logical endpoint of decades of technological development in financial markets, and it has profound, practical consequences for every retail trader operating in these same spaces. The spreads you see, the price you get when you click buy, the sudden gap in a chart that nobody seems to be able to explain — all of these are, to varying degrees, a product of the algorithmic environment. Understanding that environment does not require a mathematics degree or a background in software engineering. It requires knowing, at a conceptual level, what the machines are trying to do, and why their collective behaviour sometimes makes markets behave in ways that feel irrational or even hostile to the individual trader.
What a Trading Algorithm Actually Is
Strip away the mystique and an algorithm is simply a set of rules. It is a decision tree that a programmer has translated into code: if this condition is true, then execute this action. In trading, those conditions might be price levels, volume thresholds, the ratio between two assets, the arrival of new information, or the state of an order book. The action might be to buy, to sell, to post a limit order, to cancel an existing order, or to adjust a quote. What makes algorithmic trading different from a human trader following a similar set of rules is not the logic itself — it is the speed and scale at which the logic is applied.
A human trader can perhaps execute a handful of decisions per minute. An algorithmic system can execute thousands per second. At the extreme end of the spectrum, high-frequency trading (HFT) firms operate systems that can complete an entire cycle — receiving market data, processing it, making a decision, and sending an order — in a matter of microseconds. To put that in context, a single blink of a human eye takes approximately 150,000 microseconds. By the time you have registered a price on your screen, an HFT system may have already bought and sold the same stock dozens of times.
The scale of this activity is significant. Across the US equity market and major European exchanges, algorithmic trading accounts for somewhere between 60 and 80 per cent of total daily volume by most credible estimates. At the London Stock Exchange, algorithmic systems began to dominate order flow in the mid-2000s, and by the time MiFID II — the Markets in Financial Instruments Directive — came into force across the UK and EU in January 2018, the regulatory framework had already accepted algorithmic trading as the structural norm and moved instead to the question of how to govern it. The FCA today requires firms using algorithmic trading strategies to register those strategies, maintain kill switches capable of halting them instantly, and submit to audit trail requirements that ensure regulators can reconstruct what happened and why.
Understanding the algorithmic world does not mean understanding every variant of every strategy. It means understanding the three or four core categories of activity that between them account for the vast majority of what machines are doing in the market at any given moment.
From Open Outcry to the Server Room
The shift to automated trading did not happen overnight. Its roots lie in the gradual computerisation of exchange infrastructure that began in the 1970s and accelerated through the 1980s and 1990s. The London Stock Exchange moved to fully electronic trading with the introduction of the Stock Exchange Electronic Trading Service (SETS) in 1997, removing the final vestiges of physical open-outcry from UK equity markets. Across the Atlantic, the fragmentation of US equity markets — driven by regulatory changes that broke the NYSE’s near-monopoly on order flow — created fertile conditions for any technology that could operate across multiple venues simultaneously.
In those early years, algorithmic trading was largely confined to large investment banks using automated systems to execute institutional orders more efficiently. A fund manager wanting to buy five million shares of a particular stock without moving the price dramatically would use an algorithm to slice that order into hundreds of smaller pieces, distributing them across the trading day according to volume patterns — strategies that became known as VWAP (Volume-Weighted Average Price) and TWAP (Time-Weighted Average Price) execution. The goal was not profit from the algorithm itself, but better execution of a human decision. These execution algorithms still exist and remain widely used today, though they represent only one strand of the algorithmic universe.
The emergence of proprietary algorithmic trading — machines trading for their own account, not on behalf of clients — gathered momentum in the early 2000s. Advances in co-location services, which allowed trading firms to place their servers physically inside exchange data centres and eliminate network latency, gave early adopters a decisive speed advantage. Firms that could receive market data and transmit orders faster than their competitors were able to act on price discrepancies before others could react. By 2009 and 2010, studies were suggesting that over 70 per cent of US equity volume was generated by algorithmic systems — a figure that reflected not just the spread of the technology, but the speed at which it had displaced human market-making in the most liquid parts of the market.
The historical turning point most frequently cited in any discussion of algorithmic trading is the so-called Flash Crash of 6 May 2010. In the space of approximately 36 minutes, the Dow Jones Industrial Average fell nearly 1,000 points — briefly erasing over a trillion dollars of market value — before recovering almost as rapidly. The trigger was a large automated sell order placed by a mutual fund, programmed to execute based on trading volume without regard to price or time. As HFT systems absorbed the initial selling pressure and began passing contracts between themselves in what regulators later described as a kind of electronic hot potato, liquidity evaporated. Firms posted stub quotes at extreme prices simply to maintain system compliance, and market orders hit those quotes in cascading fashion. The Chicago Mercantile Exchange tripped a circuit breaker and paused trading for five seconds; when trading resumed, the selling pressure had passed and prices recovered. The entire episode lasted minutes. The damage, briefly, was extraordinary.
The Flash Crash did not prove that algorithmic trading was inherently dangerous. What it demonstrated was that the interaction between multiple automated systems — each behaving rationally according to its own instructions — could produce collectively irrational outcomes under the right conditions. That lesson has shaped regulation and risk management thinking ever since.

What the Machines Are Actually Doing
At any moment during a trading session on the London Stock Exchange or NYSE, the algorithmic activity in the market can be roughly sorted into several distinct categories. Each pursues a different objective, operates on a different time horizon, and has a different effect on the market conditions that retail traders experience.
Algorithmic Market Making
Market making is the activity of simultaneously posting a bid price and an offer price for a security — standing ready to buy from anyone who wants to sell, and to sell to anyone who wants to buy, at all times. It is the mechanism by which markets maintain liquidity. Historically, market making was performed by human specialists and dealers whose profit came from the spread between the bid and offer — the small gap between the price at which they would buy and the price at which they would sell. Today, in the most liquid equity markets, algorithmic market makers have largely replaced human dealers.
The business model for an algorithmic market maker is fundamentally the same as it was for a human one: earn the spread, repeat. But the algorithmic version can operate at a scale and precision that no human could match. An algorithmic market maker might be simultaneously quoting prices in thousands of securities, adjusting those quotes in real time as conditions change, and executing millions of transactions per day. Firms such as Citadel Securities, Virtu Financial, and XTX Markets — a London-based proprietary trading firm founded in 2015 — now collectively provide a substantial proportion of the displayed liquidity in major equity markets. Estimates suggest that the largest six HFT principals furnish between 30 and 40 per cent of displayed depth on major venues.
The critical characteristic of algorithmic market making, from the perspective of a retail trader, is that it is conditional. A human market maker, operating within a regulatory framework that required continuous quoting, had a degree of obligation to the market. An algorithmic market maker operating as a proprietary firm has none. Its participation is entirely voluntary, and its algorithms are designed to withdraw from the market — cancelling outstanding quotes and ceasing to post new ones — whenever conditions become sufficiently uncertain or volatile. This is not malicious behaviour. It is rational behaviour. The same speed that makes algorithmic market makers extraordinarily efficient in calm markets makes their simultaneous withdrawal from troubled markets extraordinarily consequential.
Statistical Arbitrage
Statistical arbitrage, often shortened to stat arb, is the practice of identifying persistent statistical relationships between two or more securities and trading on deviations from those relationships with the expectation that they will revert to their historical norm. The most accessible version of this is pairs trading. Consider two companies in the same sector — say, two large UK-listed banks. Over time, their share prices tend to move in tandem because they are exposed to the same macroeconomic forces: interest rate decisions by the Bank of England, changes in regulatory capital requirements, the state of the UK mortgage market. When one bank’s share price temporarily diverges from its usual relationship with the other — perhaps because of a stock-specific news event that creates an oversized short-term move — a stat arb algorithm identifies the divergence, buys the relatively underpriced security, and sells the relatively overpriced one, waiting for the relationship to reassert itself.
The elegance of the strategy is that it is theoretically market-neutral — the algorithm does not need to take a view on whether the sector as a whole is going up or down. It only needs to be right about the relationship between the two instruments. Modern stat arb systems operate far beyond simple pairs, however. Renaissance Technologies, the US-based quantitative hedge fund often cited as the most successful trading firm in history, built its Medallion fund around statistical arbitrage principles applied simultaneously across thousands of securities using techniques that its founders and employees have never publicly disclosed in any meaningful detail. The principle, however — identify patterns in relative prices, trade on divergences, profit from mean reversion — remains the core of a very large category of algorithmic activity in today’s markets.
Momentum and Signal Execution
A third major category of algorithmic activity involves systems that identify and trade on directional momentum — the tendency of assets that have been rising to continue rising, and assets that have been falling to continue falling, over short time horizons. Momentum is one of the most well-documented anomalies in financial markets, and there is a substantial body of academic evidence suggesting it persists across multiple asset classes and time horizons. Algorithmic momentum strategies attempt to capture it systematically, identifying situations where price velocity and volume characteristics suggest a directional move is likely to continue, entering positions accordingly, and exiting quickly when the signal deteriorates.
At the HFT end of the spectrum, momentum strategies operate at milliseond and sub-millisecond levels, picking up order flow imbalances in the limit order book and positioning fractionally ahead of moves that are implied but not yet reflected in the last traded price. At longer horizons — minutes to hours rather than milliseconds — systematic momentum strategies sit closer to what human traders might recognise as trend-following, and in those cases the algorithms are effectively competing with technical traders who use chart patterns and moving averages to identify similar signals. The difference is execution speed, consistency of application, and the volume of data that can be processed simultaneously.
Index Rebalancing and Event-Driven Algorithms
A fourth category that has grown substantially in importance relates to the predictable trading flows generated by index rebalancing events. When the composition of a major index — the FTSE 100, for instance — is adjusted following a quarterly review, index-tracking funds are required to buy the newly added constituents and sell those that have been removed. This creates entirely predictable demand at known points in time, and algorithmic trading systems have become extraordinarily adept at anticipating it. Firms parse index compiler announcements, calculate the likely buying and selling pressure from passive funds, and position ahead of the inevitable flows. The result, from the perspective of passive investors, is that index inclusion is systematically expensive: when a stock enters the FTSE 100, algorithms have already bought it in anticipation, and passive funds end up paying a premium to acquire what the algorithms are ready to sell.
The Market You Actually Trade In
Knowing that algorithms exist and dominate volume is one thing. Understanding how their collective presence reshapes the market conditions that a retail trader experiences is quite another, and it is here that the practical implications become most relevant.
Tighter Spreads — and What That Really Means
The most immediately beneficial effect of widespread algorithmic market making has been a dramatic compression of bid-offer spreads. In the era of human market makers, spreads on even the most liquid FTSE 100 stocks could be several pence wide. Today, on a stock like Rolls-Royce or Barclays, the spread in the central limit order book is typically a fraction of a penny at the touch. For retail traders executing smaller positions, this is an unambiguous improvement in execution quality. The cost of getting into and out of a position has fallen substantially, and that reduction in transaction costs — applied across millions of trades — represents a real transfer of value to the trading public.
The important qualification is that this competitive spread environment exists principally in calm, liquid conditions. Algorithmic market makers earn their spread income by participating continuously when conditions are predictable and the risk of holding inventory is low. When uncertainty rises — during earnings announcements, central bank decisions, geopolitical shocks, or the kind of cascade event that characterised the 2010 Flash Crash — the algorithms withdraw. Spreads widen sharply and suddenly. The liquidity that seemed abundant moments before becomes scarce almost instantaneously. Traders who attempt to exit positions during these moments of stress find that the market they thought they knew has changed shape beneath them.
Price Discovery — Faster but More Fragile
Price discovery — the process by which markets incorporate new information into prices — is genuinely faster in an algorithmic environment. When the Bank of England releases an unexpected interest rate decision, or when a company issues a profit warning before market open, algorithmic systems process the information and adjust prices across hundreds of related instruments within milliseconds. By the time a human trader has read the headline, the primary adjustment is already complete. For a retail trader, this is neither uniformly good nor bad — it means that responding to news as a strategy is largely futile unless the response is built in advance, but it also means that prices on the screen are more accurately reflecting current information than they were in the era of human-intermediated markets.
The fragility in this system arises when algorithms themselves become the primary source of information driving prices. In normal markets, algorithmic systems are processing a mixture of fundamental information (company news, economic data), technical signals (momentum, volume patterns), and structural flow (order book imbalances, index rebalancing). When fundamental information is thin and trading activity is dominated by algorithms reading each other’s signals, there is a risk of what researchers call phantom liquidity or a liquidity mirage: the appearance of depth in the order book that evaporates the moment a trader tries to interact with it. An algorithmic market maker quotes a large size at a given price, but it is monitoring every other signal in the market simultaneously — and the moment order flow suggests that its quote is about to be hit in a way that would leave it holding inventory in a deteriorating market, it cancels. The size disappears. The depth was real only in the sense that it would have been filled under conditions that never quite arrived.
The Spoofing Problem
Not all algorithmic behaviour is legitimate. Spoofing — the practice of placing large orders on one side of the market with no genuine intention of executing them, in order to create a false impression of supply or demand and move prices in a desired direction — is explicitly illegal under UK market abuse law and equivalent regulations in the US and EU. It is, however, detectable only with sophisticated surveillance technology, and its effects can be significant for retail traders who read order book depth as meaningful information about supply and demand.
The FCA’s market surveillance systems, enhanced significantly by the data requirements introduced under MiFID II, have become considerably more capable of identifying spoofing patterns over time. The case of Navinder Sarao — the Hounslow-based trader whose algorithmic spoofing of E-mini S&P futures was cited as a contributing factor in the events of May 2010 — demonstrated both the scale of the problem and the capacity of regulators to eventually identify and prosecute it. Sarao operated from a house in a west London suburb using software built to his specification, placing and cancelling thousands of orders per second to create the appearance of substantial selling pressure. His actions were one element in a much larger and more complex story about market structure, but they illustrated that algorithmic manipulation, like human manipulation, is a real and persistent feature of the landscape.
The Flash Crash: A Timeline
On 6 May 2010, the Dow Jones Industrial Average lost nearly 1,000 points in approximately 36 minutes before recovering almost entirely. The sequence began with a $4.1 billion automated sell order placed by a mutual fund, programmed to execute at 9% of prevailing trading volume with no price or time constraints. As high-frequency systems absorbed the initial selling and began passing contracts between themselves — with insufficient external demand to absorb the volume — futures market liquidity collapsed. Equity algorithms detected the stress and began unwinding positions. Stub quotes at absurd prices were filled by market orders unable to find real liquidity. The Chicago Mercantile Exchange tripped a circuit breaker and paused trading for five seconds. When it resumed, the cascade had broken and prices recovered. The episode is still the most widely studied example of what can happen when multiple rational algorithms interact under stress.
Putting the Algorithm to Work — For You
The practical question for a retail trader is not how to build an algorithmic system — that is a separate discipline requiring programming skills, infrastructure, and regulatory understanding — but how to trade more effectively in an environment that is already shaped by them. There are several areas where awareness of algorithmic behaviour translates directly into better decisions.
Understanding Spread Behaviour Around Events
The single most actionable insight from algorithmic market making behaviour is that spreads are not constant. They widen sharply and unpredictably around any event that creates uncertainty, because algorithmic market makers withdraw when their models cannot accurately price the risk of holding inventory. For a retail trader, this means that executing a market order in the seconds immediately before or after a major announcement — a Bank of England Monetary Policy Committee decision, a company earnings release, a significant macro data print — will almost always result in worse execution than trading in calmer conditions. The spread you see in normal times is not the spread you will get in those moments. If the trade is time-sensitive, limit orders become essential. If it is not time-sensitive, waiting for the algorithmic environment to restabilise — typically within minutes of the initial shock — is usually the more efficient choice.
Treating Order Book Depth With Scepticism
Retail traders who use level 2 data — the visible order book showing bids and offers beyond the best quote — should be aware that much of what they see is provisional. Algorithmic market makers and momentum strategies maintain a large proportion of the visible depth in any liquid order book, and a meaningful fraction of those orders will be cancelled before execution if the conditions under which they were placed change. This does not mean level 2 data is useless. It means it should be read as an indication of current algorithmic sentiment rather than as a reliable measure of genuine committed interest. Large visible bids that disappear the moment price approaches them are a common feature of algorithmic markets; experienced traders develop a feel for the difference between depth that is structural and depth that is ephemeral.
Momentum Alignment
Because a significant volume of algorithmic activity is momentum-driven, trend signals that emerge in liquid markets tend to be reinforced by algorithmic participation rather than quickly arbitraged away. This has implications for trading strategy. A breakout from a well-established range in a liquid FTSE 100 stock, accompanied by strong volume, is more likely to see follow-through in an algo-dominated market than it might have in a market populated primarily by human participants making independent judgements. The algorithms are reading similar signals and responding in similar ways. The risk, equally, is that when momentum exhausts itself, algo withdrawals can make the reversal as rapid and violent as the initial move. Trading momentum in an algorithmic environment means having a clear plan for the exit before the entry is placed.
Being Alert to Index Rebalancing Windows
FTSE Russell announces changes to the composition of its indices four times per year. The announcement date, the effective date, and the closing auction on the effective date are all periods of significant, predictable algorithmic activity. Stocks that are about to enter the FTSE 100 typically see sustained buying pressure in the days following the announcement as algorithms position ahead of passive fund demand. Stocks being removed see the opposite. For a retail trader who monitors the FTSE Russell announcement calendar, these predictable flow windows represent one of the clearest cases in financial markets where institutional behaviour is both identifiable in advance and systematic in its execution. The strategy does not always work cleanly — algos have already priced in much of the movement by the time the announcement is made public — but an understanding of the mechanics allows a trader to avoid the worst execution consequences of trying to trade against the flow during rebalancing periods.
The Regulatory Context
UK retail traders operate in a market where the algorithmic environment is regulated, monitored, and — to a meaningful degree — constrained. MiFID II, which the UK retained in domestic law following its departure from the European Union, imposes substantive obligations on firms using algorithmic strategies: mandatory kill switches, annual validation reports, pre-trade risk controls, and notification requirements with the FCA for any firm using algorithmic techniques. Algo-generated orders must carry identification tags that allow regulators to trace them precisely. The Market Conduct Sourcebook (MAR) in the FCA Handbook includes specific rules requiring that algorithmic systems cannot be used for any purpose contrary to the Market Abuse Regulation — meaning that the spoofing and layering strategies that contributed to the atmosphere of the 2010 Flash Crash are not only illegal but increasingly detectable through the surveillance infrastructure that MiFID II data requirements have made possible.
None of this means the algorithmic environment is perfectly fair or that manipulation has been eliminated. It means that the framework around it is substantially more robust than it was a decade ago, and that a retail trader operating through an FCA-regulated broker is trading in a market where the most egregious forms of algorithmic manipulation carry significant legal and regulatory risk for those perpetrating them. The machines are not going away. But they are, at least, operating under a set of rules that have been designed — imperfectly, and with ongoing revision — to prevent the worst outcomes.
The broader truth is one that every informed retail trader eventually reaches: the algorithmic environment is neither the enemy nor the saviour of the individual participant. It has made getting into and out of positions cheaper and faster than at any point in the history of organised markets. It has also made those markets more reflexive, more prone to short-term cascade events, and more difficult to read using tools designed for a world where human beings set prices through deliberation rather than computation. Adapting to that environment — understanding when its mechanics work in your favour, and when they do not — is not a luxury for the modern trader. It is a baseline requirement.
Bank of England Beginner bond yields Brent Crude Candlestick Charts Candlestick Patterns Charles Dow Chart Reading Commodities FCA FCA regulation fixed income FTSE 100 Fundamental Analysis gilt yields inflation interest rates ISA ISA Investing London Stock Exchange market psychology market trends OHLC price action retail investing retail trading Risk Management SIPP Sterling stocks and shares ISA Stop Loss support and resistance Swing Trading Technical Analysis Trading Basics trading education trading for beginners trading indicators Trading Signals Trading Strategy trend following trend reversal UK gilts US Treasuries yield curve
About the Author




