Trading Signals & Market Sentiment
Understanding the twin pillars that help traders identify opportunity, confirm conviction, and manage risk across every financial market

Every decision a trader makes rests on two fundamental questions: what is the market telling me right now, and how do market participants collectively feel about the future? The answers live in two bodies of analysis that, when used together, form perhaps the most powerful toolkit in active trading — trading signals and market sentiment. These are not abstract concepts confined to textbooks; they are living, evolving sources of information generated every second the markets are open, and learning to read them with precision separates reactive trading from genuinely informed decision-making.
At their simplest, trading signals point toward potential price action — moments where the data suggests a security may be ready to move in a particular direction. Sentiment, by contrast, captures the mood behind those movements: the fears, expectations, and convictions that drive market participants to buy, sell, or stand aside. Neither signal nor sentiment is infallible on its own. Together, however, they create a layered picture of market conditions that is far richer than either could provide alone.
What Are Trading Signals and Market Sentiment?
Defining the Trading Signal
A trading signal is, at its core, a data-driven indication that a buying or selling opportunity may be emerging in a particular asset. It is the output of an analytical process — the conclusion reached after examining price behaviour, financial data, or mathematical models — that a trader can act upon, investigate further, or use as one layer in a broader decision. Signals are not commands. They are prompts: carefully constructed prompts that tell an attentive trader where to look and what question to ask next.
Signals arise from three primary analytical traditions: technical analysis, fundamental analysis, and quantitative analysis. Each speaks a slightly different language, draws on different raw materials, and reveals a different dimension of market behaviour. Understanding what distinguishes them — and how they can complement one another — is essential for any trader seeking to build a coherent, evidence-based approach.
Defining Market Sentiment
If signals represent what the data says, sentiment represents what people believe. Market sentiment is the collective psychological disposition of all participants toward an asset, sector, or the market as a whole at any given moment. It can be bullish, meaning participants broadly expect prices to rise and are positioning accordingly, or bearish, meaning they anticipate declines. Crucially, sentiment can persist for extended periods even when it diverges from what the underlying data might justify — and in those divergences lie some of the most significant trading opportunities.
“Markets can remain irrational longer than you can remain solvent — but understanding sentiment is precisely how you recognise when irrationality is reaching its limit.”
Sentiment is measured through several distinct lenses, each capturing a different facet of collective market psychology. News coverage, social media activity, options positioning, and the reported holdings of large institutional traders all contribute signals about mood and conviction in ways that pure price data cannot capture. Used together, these sources paint a remarkably detailed portrait of where market participants are mentally and financially positioned at any given time.
A Brief History: From the Trading Pit to the Algorithm

The concept of using price patterns to anticipate future movements stretches back centuries. In eighteenth-century Japan, a rice merchant named Munehisa Homma developed what would become the foundational framework of candlestick charting — a system for reading price behaviour so sophisticated that it remains in daily use by millions of traders around the world today. Homma recognised early what modern behavioural finance has since confirmed in exhaustive detail: that markets are not simply aggregations of rational decisions, but are shaped by human emotion, crowd psychology, and recurring patterns of fear and greed.
The formal tradition of technical analysis gained broader recognition in the West through the work of Charles Dow in the late nineteenth century. Dow observed that market movements contained discernible trends and that secondary movements within those trends followed predictable patterns. His observations, refined by later analysts into what became known as Dow Theory, established the intellectual scaffolding upon which modern technical analysis is built. By the early twentieth century, figures such as Jesse Livermore had demonstrated in practice that reading price action and crowd sentiment could generate extraordinary returns — and equally catastrophic losses when sentiment was misread.
Fundamental analysis, meanwhile, gained its rigorous academic foundations through the work of Benjamin Graham and David Dodd, whose landmark text Security Analysis, published in 1934, established the discipline of valuing companies through their financial statements and economic characteristics. Warren Buffett, Graham’s most celebrated student, would go on to demonstrate over decades that a disciplined fundamental approach, grounded in patience and the careful reading of business quality and price, could compound wealth at rates that defied conventional expectation.
Quantitative and sentiment-based analysis emerged as serious disciplines in the latter half of the twentieth century, accelerated by the computing revolution and the explosion of available data. The Commitment of Traders report, which remains one of the most closely-watched sentiment tools today, was first published by the United States Commodity Exchange Authority in 1962. Options markets, which provide rich sentiment data through the behaviour of call and put buyers, expanded dramatically following the launch of the Chicago Board Options Exchange in 1973. Social media sentiment analysis is the youngest of these disciplines, emerging only in the 2010s as researchers and traders recognised that the collective conversations of millions of retail investors, professionals, and commentators on platforms like Twitter and Reddit contained genuine and actionable market information.
What Each Tool Does: A Closer Examination
Technical Analysis Signals
Technical analysis begins with a deceptively simple premise: that all publicly available information — every known fact, expectation, and rumour — is already reflected in an asset’s price. If that is true, then studying the history of price and volume behaviour is a study of how market participants have collectively processed information over time, and patterns in that history can provide probabilistic guidance about future behaviour.
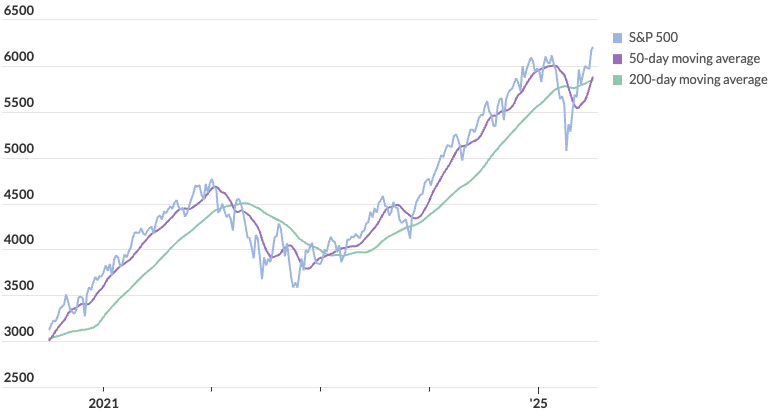
Moving averages smooth out the noise inherent in raw price data to reveal the underlying trend. A simple moving average calculates the mean closing price over a defined lookback period — 20 days, 50 days, 200 days — and plots that value as a continuous line. When the shorter-period average crosses above the longer-period average, the resulting formation, known as a golden cross, is widely interpreted as a bullish signal. When the reverse occurs — the shorter average falls below the longer — it is called a death cross and is considered bearish. Exponential moving averages apply greater mathematical weight to more recent price data, making them more responsive to current conditions at the cost of greater sensitivity to short-term noise.
Support levels are price zones where demand has historically emerged and halted declines; resistance levels are zones where selling pressure has historically constrained rallies. These are not arbitrary lines. They represent the accumulated memory of the market — the price levels where large numbers of participants previously bought or sold, and where psychological anchoring means they are likely to act again. A decisive break through a resistance level, particularly on elevated volume, is a classic bullish signal. The same level, once breached, often becomes support on subsequent pullbacks — a phenomenon traders describe as a role reversal.
Candlestick patterns distil price behaviour within a defined time period into a compact visual form that reveals the battle between buyers and sellers. A bullish engulfing pattern — where a large positive candle fully encompasses the body of the preceding negative candle — suggests that buyers have wrested control from sellers with conviction. A doji, where the opening and closing prices are virtually identical despite significant intra-period movement, signals indecision and potential reversal. Hammer and shooting star formations at key support and resistance levels carry particular significance. The power of candlestick analysis lies not in any single candle but in the contextual reading of sequences — what the pattern reveals about the psychology of buyers and sellers at a decisive moment in price structure.
Fundamental Analysis Signals
Where technical analysis is agnostic about the underlying business or economy and cares only about price and volume, fundamental analysis interrogates the substance behind the price. It asks whether an asset is worth what the market is currently charging for it, and what the trajectory of its underlying business or economic environment suggests about future value. Fundamental signals are not as immediate as their technical counterparts — they unfold over weeks, quarters, and years rather than minutes and days — but for patient traders and investors, they provide a grounding that price-based signals alone cannot offer.
Earnings reports are among the most powerful fundamental signals available to equity traders. When a company reports earnings that significantly exceed consensus analyst expectations — what markets call an earnings surprise — the stock often moves sharply higher as investors revise their valuation models upward. The magnitude and quality of that revision — whether it stems from revenue growth, margin expansion, or one-off items — determines how durable the resulting price move tends to be. Equally important is forward guidance: what management projects for the coming quarters. Markets are relentlessly forward-looking, and even a strong historical result can trigger selling if the outlook is downgraded.
At the macroeconomic level, signals flow from central bank interest rate decisions, inflation prints, employment reports, and GDP releases. A surprise cut in interest rates, for instance, is broadly bullish for equities and bonds, as lower borrowing costs reduce the discount rate applied to future earnings and stimulate economic activity. Conversely, persistently high inflation that forces central banks into restrictive monetary policy creates headwinds for risk assets. Traders who understand the relationships between macroeconomic variables and asset prices can position themselves in advance of major data releases with a well-reasoned fundamental view.
Quantitative Analysis Signals
Quantitative analysis applies mathematical rigour to the search for trading signals, processing datasets of a scale and complexity that are beyond any human analyst working manually. Quantitative strategies range from relatively straightforward statistical arbitrage approaches — exploiting price discrepancies between related securities — to sophisticated machine learning models that identify non-linear relationships in vast quantities of structured and unstructured data. High-frequency trading firms use quantitative signals that operate on timescales measured in microseconds. Systematic hedge funds run quantitative models over daily or weekly timeframes, seeking persistent statistical edges in market behaviour.
What distinguishes quantitative analysis is its insistence on rigorous backtesting and its relative freedom from the cognitive biases that afflict discretionary trading. A quantitative model does not get excited by a compelling narrative or reluctant to exit a losing position; it executes according to its rules. The risks, however, are equally characteristic: quantitative models are built on historical data and may fail when market regimes change, and the crowding of similar strategies can amplify volatility when many participants attempt to exit positions simultaneously.
News Sentiment
Financial markets respond to information, and news is one of the primary channels through which new information arrives. News sentiment analysis attempts to quantify the emotional valence of coverage — whether it skews positive, negative, or neutral — for a given asset or market. Historically, this was done manually by analysts reading and categorising articles. Today, natural language processing algorithms can analyse millions of articles, headlines, and press releases in real time, producing quantitative sentiment scores that traders incorporate into their models.
The relationship between news sentiment and price is complex. Positive coverage can drive buying, but if the news is expected, much of the price impact may already be priced in — a phenomenon captured in the old trading maxim “buy the rumour, sell the news.” Conversely, consistently negative coverage can drive overcorrection, creating situations where an asset becomes undervalued relative to its fundamentals. The skilled use of news sentiment, therefore, requires not just measuring the tone of current coverage but comparing it against expectations and understanding how the market has historically reacted to similar information.
Social Media Sentiment
The rise of retail investing platforms and social media has created an entirely new and powerful source of sentiment data. Platforms such as Reddit’s WallStreetBets community, X (formerly Twitter), and Stocktwits generate enormous volumes of opinion, analysis, and emotional expression about specific stocks, commodities, and currencies in real time. In January 2021, the extraordinary short squeeze in GameStop shares demonstrated, in dramatic fashion, that coordinated retail sentiment expressed through social media could generate price movements that overwhelmed even large institutional short positions.
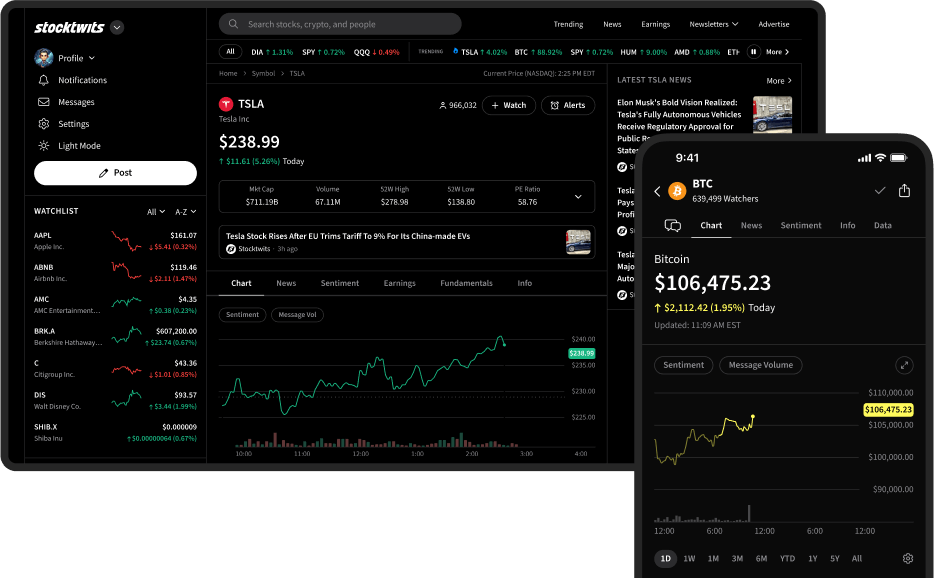
Social media sentiment is a particularly interesting signal because it captures the retail investor base — a group whose behaviour is increasingly significant given the dramatic growth of self-directed investing in recent years. However, social media sentiment is also highly susceptible to noise, manipulation, and reflexivity — the tendency for the signal itself to become part of the story, as media coverage of unusual social media activity around a stock can amplify the very sentiment it is reporting on. Traders who use social media sentiment therefore do so with careful filtering, looking for sustained shifts in discussion rather than isolated spikes.
Options Market Sentiment
The options market provides a uniquely rich window into the expectations and positioning of sophisticated market participants. When traders buy call options, they are paying for the right to purchase an asset at a predetermined price — an inherently bullish act. When they buy put options, they are buying protection against, or the right to profit from, price declines — an inherently bearish act. The ratio of put options to call options traded at any given time, known as the put/call ratio, therefore serves as a real-time gauge of directional bias in the options market.
What makes the put/call ratio particularly useful as a contrarian indicator is that extreme readings tend to precede reversals. When the ratio spikes to historic highs — meaning far more puts than calls are being purchased — it reflects widespread bearish positioning that often reaches a point of exhaustion shortly before a market bottom. The logic is that if virtually everyone who is going to sell has already sold (and hedged with puts), there is little selling pressure left and fresh buying can drive a sharp reversal. The reverse applies at market peaks, where excessive optimism manifested in very low put/call ratios has historically accompanied topping processes.
Implied volatility, a derivative of options pricing, provides another layer of sentiment information. When options buyers are collectively willing to pay elevated premiums, implied volatility rises — signalling that participants expect large price swings, typically in fearful or uncertain conditions. The VIX index, often called the “fear gauge” of financial markets, measures the implied volatility of S&P 500 options and has become one of the most widely followed sentiment indicators in the world.
Commitment of Traders Reports
Published every Friday afternoon by the United States Commodity Futures Trading Commission, the Commitment of Traders report discloses the aggregate positions held by three categories of market participants in regulated futures markets: commercial hedgers (such as agricultural producers or energy companies managing real-world exposure), large non-commercial speculators (typically hedge funds and managed money accounts), and small non-reportable traders (retail participants whose positions fall below the reporting threshold).
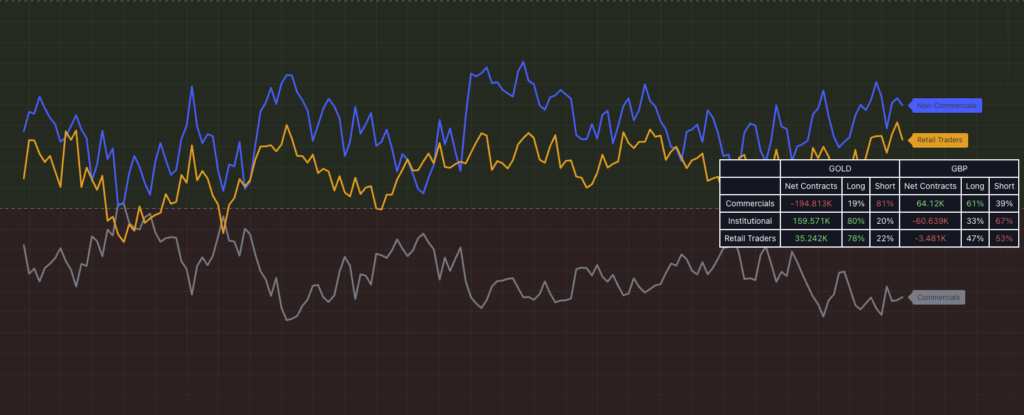
The positions of commercial hedgers and large speculators are, in many respects, the most informative. Commercial hedgers are typically regarded as the “smart money” in commodity markets because they are intimately familiar with supply and demand fundamentals in their industry. When they hold unusually large long or short positions, it may reflect their expectation of price movements driven by fundamental factors not yet reflected in prices. Large speculative positions, by contrast, tend to follow trends and can become stretched to extremes that precede reversals. Tracking when speculative positioning is at historical extremes, particularly when it diverges from commercial positioning, is a well-established approach to identifying potential turning points in commodity and currency markets.
How Traders Utilise Signals and Sentiment
The real power of signals and sentiment emerges not from any single indicator in isolation, but from the disciplined practice of confluence — the art of requiring multiple independent lines of evidence to align before committing to a position. A trader who acts on every technical signal will find themselves whipsawed by noise. A trader who waits for a technical signal confirmed by fundamental clarity and backed by supportive sentiment is working from a far stronger foundation.
Before executing any significant trade, experienced traders often run through a structured checklist to ensure signals and sentiment are aligned. A robust checklist might ask: Does the primary technical signal have context — does it occur at a meaningful level in the price structure? Does the fundamental picture support the directional bias suggested by the technical signal? Is prevailing sentiment consistent with the trade direction, or does it present a contrarian warning? Is options market positioning providing confirmation or contradiction? Is position sizing appropriate given the degree of confluence present? The more of these questions that can be answered affirmatively and consistently, the higher the quality of the trading opportunity.
At a Glance: Signals and Sentiment Tools
| Tool | Category | Primary Use | Timeframe |
|---|---|---|---|
| Moving Averages | Technical Signal | Trend identification, crossover signals | All timeframes |
| Support & Resistance | Technical Signal | Entry, exit, and stop placement | All timeframes |
| Candlestick Patterns | Technical Signal | Short-term reversal and continuation signals | Intraday to weekly |
| Earnings Reports | Fundamental Signal | Valuation revision and trend changes | Quarterly |
| Economic Data Releases | Fundamental Signal | Macro positioning and regime identification | Monthly/quarterly |
| News Sentiment Score | Sentiment | Short-term mood tracking and mean reversion | Daily to weekly |
| Social Media Sentiment | Sentiment | Retail positioning and momentum extremes | Real-time to daily |
| Put/Call Ratio | Sentiment | Contrarian reversal signals at extremes | Daily to weekly |
| VIX (Implied Volatility) | Sentiment | Fear/complacency gauge, regime identification | Daily to monthly |
| COT Report | Sentiment | Institutional positioning, trend exhaustion | Weekly |
Putting It All Together
The most effective traders approach signals and sentiment not as a collection of isolated tools but as an interconnected analytical ecosystem. Each tool answers a different question and operates on a different timescale, and the art of synthesis — combining the right tools in the right proportions for the right market conditions — is ultimately what distinguishes consistent performance from guesswork. A long-term position trader will lean heavily on fundamental signals and COT positioning. A swing trader will weight technical signals and options sentiment. An intraday trader will focus on technical microstructure and real-time news flow. The tools remain the same; their relative emphasis shifts with the strategy and timeframe.
It is equally important to understand that no combination of signals and sentiment analysis eliminates the inherent uncertainty of financial markets. Markets are complex adaptive systems populated by participants who are themselves continuously learning and adapting. Any edge identified through signal and sentiment analysis can and will be eroded as others discover and trade it. The traders who sustain long-term performance are those who combine rigorous analytical discipline with intellectual humility, continuous learning, and a genuine respect for risk management. They treat each trade as a probabilistic outcome and manage their portfolios accordingly, rather than treating any signal or sentiment reading as a guarantee.
What signals and sentiment analysis ultimately offers is not certainty, but clarity — the clarity that comes from asking disciplined questions of the market, gathering evidence systematically, and making decisions based on the weight of that evidence rather than on impulse, hope, or fear. In the perpetually uncertain arena of financial markets, that disciplined clarity is among the most valuable assets any trader can possess.
Bank of England Beginner bond yields Brent Crude Candlestick Charts Candlestick Patterns Charles Dow Chart Reading Commodities FCA FCA regulation fixed income FTSE 100 Fundamental Analysis gilt yields inflation interest rates ISA ISA Investing London Stock Exchange market psychology market trends OHLC price action retail investing retail trading Risk Management SIPP Sterling stocks and shares ISA Stop Loss support and resistance Swing Trading Technical Analysis Trading Basics trading education trading for beginners trading indicators Trading Signals Trading Strategy trend following trend reversal UK gilts US Treasuries yield curve



