The Foundations of Market Participation
The Stock Market: How Prices Move, Trades Settle, and Participants Fit In
A thorough guide to how the stock market actually functions — from the mechanics of a single trade to the different ways participants choose to engage with it.

The Marketplace and Its Purpose
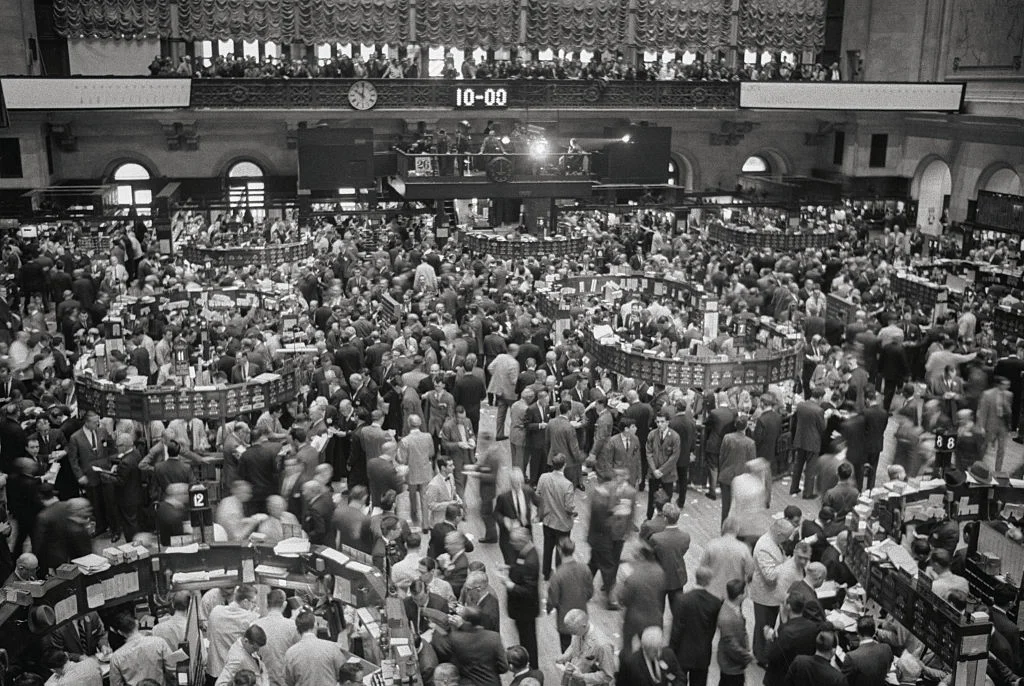
At its most fundamental level, the stock market is an organised, electronic marketplace where buyers and sellers come together to transact in the shares of publicly listed companies. It is not a physical room filled with shouting traders, though that image once held true. Today it is a vast, interconnected network of computers and algorithms that match millions of orders every second, executing trades with a speed and precision that would have seemed extraordinary just a few decades ago.
When a company completes an Initial Public Offering and its shares begin trading on an exchange, a new chapter begins. The company has raised its capital; the investment banks have taken their fees; and the shares now belong to public investors who are free to buy and sell them as they see fit. From that point forward, the company no longer receives money when its stock changes hands. The trading that takes place on the exchange is entirely between market participants themselves — buyers and sellers exchanging ownership, with the exchange acting as the trusted intermediary that ensures both sides honour their obligations.
Once a company is publicly traded, it is also obligated to disclose all material information to the public on an ongoing basis. Earnings reports, boardroom changes, regulatory filings, dividend announcements — all of it enters the public domain on a schedule that regulators enforce rigorously. This continuous flow of information is precisely what gives the stock market its restless energy. Prices are not static; they are a living expression of how the collective of market participants interprets the latest available information about a company, an industry, or the economy as a whole.
The market’s core function — matching buyers and sellers — sounds simple, but the infrastructure behind it is considerable. Stock exchanges such as the London Stock Exchange, the New York Stock Exchange, and the NASDAQ provide centralised platforms where securities are listed and traded under standardised rules. Regulatory bodies, such as the Financial Conduct Authority in the United Kingdom and the Securities and Exchange Commission in the United States, oversee these markets to prevent manipulation, enforce transparency, and protect investors. Beneath that regulatory layer sit clearing houses, depositories, brokers, and market makers, each playing a defined role in ensuring that when a trade is agreed, it completes smoothly and securely.
Two Centuries of Exchange
The concept of trading shares in a joint enterprise is older than most people realise. The Amsterdam Stock Exchange, established in 1602 to trade shares of the Dutch East India Company, is widely regarded as the world’s first formal stock exchange. By the early eighteenth century, London had developed its own active market for shares and government securities, with traders gathering in the coffee houses of Exchange Alley before the London Stock Exchange was formally constituted in 1801.
For much of this history, settlement — the process of actually transferring shares from seller to buyer and cash in the opposite direction — was a slow, paper-based affair. In the seventeenth and eighteenth centuries, the Amsterdam and London markets were so closely intertwined that a standard settlement period of fourteen days evolved naturally: it was roughly the time required for a courier to travel between the two cities by horse and ship, carrying the physical certificates and payments. The paperwork had to physically move before ownership could be confirmed. Those fourteen-day conventions formed the template for settlement cycles that would persist in various forms for hundreds of years.
The twentieth century brought gradual mechanisation, and with it the compression of settlement times. By the 1990s, most major markets operated on a T+3 basis — meaning that a trade executed on a given day would not be fully settled until three business days later. In 2017, US markets shortened this to T+2, and in May 2024 they moved again to T+1, settling the vast majority of equity transactions within a single business day of the trade. The United Kingdom and European markets have followed similar paths, with ongoing discussion about transitioning to T+1 as technology and infrastructure continue to improve. The long arc of settlement history is one of progressive compression: from fourteen days to one, driven relentlessly by improved communications, electronic record-keeping, and centralised clearing infrastructure.
The move away from paper certificates to electronic, or dematerialised, records was equally transformative. Rather than a physical share certificate changing hands, ownership is now recorded electronically in a depository or DEMAT account. The shares exist only as entries in a database, but those entries carry exactly the same legal weight as any paper document once did, and they transfer in milliseconds rather than days.
How Prices Move and Trades Complete
Understanding what actually moves a share price is one of the most important foundations a market participant can build. The answer, at its core, is this: prices move because of differing expectations, and those expectations are constantly being revised in response to new information.
Consider a straightforward scenario. A company is trading at 300p per share when it announces, mid-morning, that it has resolved a long-running management crisis by appointing a well-regarded chief executive. Participants who had been cautious about the company’s leadership suddenly reassess their view. Those who had been waiting for precisely this kind of resolution begin to buy. As demand increases and sellers recognise that the mood has shifted, they raise their asking prices. The buyers, eager to secure shares before the price moves further, continue to transact at increasingly higher levels. Within minutes, the share price may have moved several percent on no news other than a personnel announcement — because that announcement materially changed the market’s collective expectation about the company’s future.
The reverse works with equal force. If the same company, now trading higher, faces a sector-wide warning that revenues across its industry will fall by fifteen percent over the next two years, participants who hold shares begin to reassess their position. Sellers emerge, buyers step back, and the price adjusts downward to reflect the market’s updated collective view. The more significant the news, the more violent the repricing can be. This interplay of information, expectation, and reaction is the engine behind every price movement in every market in the world.
Not all price movement is news-driven. For large, heavily traded companies — the kind with multibillion-pound market capitalisations and millions of shares changing hands each day — price fluctuates continuously simply because of the ongoing mismatch between supply and demand. At any given moment, there are participants who need to sell for reasons entirely unrelated to their view on the stock: a fund manager rebalancing a portfolio, an institutional investor raising cash to meet a redemption, a private individual taking profits after a long hold. These flows create constant, low-level price movement independent of any specific piece of news. Smaller, less liquid companies, by contrast, may see their prices barely move for days if there are no buyers and sellers actively interested in transacting.
The Mechanics of a Single Trade
When a market participant decides to buy shares, the process that follows is seamless from the participant’s perspective but involves a carefully orchestrated sequence of events behind the scenes. The participant instructs their broker — either electronically through a trading platform or, less commonly today, by telephone — specifying the stock they wish to buy, the quantity required, and the price at which they are willing to transact. The broker first verifies that sufficient funds are available in the account to cover the purchase. The order is then routed to the relevant exchange.
On the exchange, an order-matching algorithm searches for a seller willing to transact at the specified price. The counterparty may be a single seller with the entire quantity available, or the order may be filled by multiple sellers in smaller tranches — ten sellers each contributing a fraction of the total, for example. The participant receives the agreed number of shares at the agreed price regardless of how the opposing side is assembled; that complexity is invisible to them. Market makers — specialist entities that continuously quote both buying and selling prices for specific securities — play a vital role in ensuring this process runs smoothly. By standing ready to buy or sell at any moment, they provide the liquidity that allows participants to transact immediately, without having to wait for a natural counterparty to appear.
Once the trade is executed, the process of clearing and settlement begins. The clearing house acts as the central counterparty to both sides of the trade, standing between buyer and seller and guaranteeing that the transaction will complete even if one party defaults. On the settlement date — currently T+1 in the United States and moving in that direction in the UK and Europe — the shares are electronically transferred from the seller’s account to the buyer’s, and the corresponding cash moves in the opposite direction. The shares then reside in the buyer’s DEMAT or custody account, and ownership is formally recorded.
Order Types and the Bid–Ask Spread
Not all orders instruct the market to execute at whatever the current price happens to be. A market order does precisely that — it transacts immediately at the best available price, prioritising speed over price certainty. A limit order, by contrast, specifies the maximum price a buyer is willing to pay (or the minimum a seller will accept), and will only execute if the market reaches that level. A stop order activates only when the price passes a defined threshold, often used to cap losses on an existing position. Each order type serves a different purpose depending on whether the participant prioritises certainty of execution, certainty of price, or the management of downside risk.
Woven through all of this is the bid–ask spread — the gap between the highest price any buyer is currently willing to pay (the bid) and the lowest price any seller is currently willing to accept (the ask). In a highly liquid market with many participants and large trading volumes, this spread is narrow: the market is competitive and efficient, with little friction between buyers and sellers. In a thinly traded stock with few active participants, the spread can be wide, representing a real cost of entry and exit. The spread is, in essence, the price of immediacy — the cost of being able to transact right now rather than waiting for a more favourable price to appear.
Shareholder Rights After the Trade
Once shares settle into an account, the buyer becomes a part-owner of the company. The proportion of ownership is small — a few hundred shares in a company with billions outstanding represents a fraction of a fraction of a percent — but the legal rights that accompany that ownership are real and meaningful. Shareholders are entitled to receive dividends when the company distributes profits, to participate in rights issues when new shares are offered to existing holders, and in some cases to vote on significant corporate decisions at general meetings. They also benefit directly from stock splits and bonus share issues, where additional shares are credited to their account in proportion to their existing holding.
Dividend eligibility depends on precise timing. Companies set a record date — the date on which the shareholder register is reviewed to identify those entitled to a dividend payment. The ex-dividend date is the critical cut-off for buyers: to qualify for an upcoming dividend, shares must be purchased before the ex-dividend date. Under T+1 settlement, the ex-dividend date aligns with the record date, since a purchase made on the record date itself would not settle until the following day. A participant who buys shares on or after the ex-dividend date acquires the shares without entitlement to the next payment; the dividend will be paid to the previous owner instead. This interplay between settlement timelines and corporate actions is one of those market mechanics that is easy to overlook until it affects an account in an unexpected way.
Measuring What the Market Gives Back
Every decision in the market ultimately resolves into a question of return. Whether a participant holds a position for five minutes or five years, the performance of that decision is measured by how much the trade gained or lost relative to the capital committed. Two metrics dominate this measurement, and understanding the distinction between them is essential to evaluating performance honestly.
Absolute Return
Absolute return is the simplest possible measure: what percentage did the investment gain or lose from entry to exit, irrespective of how long it was held? The formula is straightforward — divide the exit value by the entry value, subtract one, and express the result as a percentage. A purchase at 300p sold at 352p generates an absolute return of approximately 17.3 percent. This figure is accurate and useful when the holding period is a year or less, where the time dimension does not meaningfully distort the comparison.
Where absolute return becomes misleading is in cross-investment comparisons over different time horizons. A return of 17 percent sounds impressive, but whether it was earned over three months or three years changes its significance entirely. Presented without a time frame, absolute return tells only half the story.
Compound Annual Growth Rate
The Compound Annual Growth Rate, universally abbreviated to CAGR, solves this problem by expressing performance as the equivalent annualised rate of growth, assuming that returns compound continuously over the holding period. If a position bought at 300p is sold at 352p after two years, the CAGR is not 17.3 percent — it is closer to 8.4 percent per year. The formula raises the ratio of exit to entry value to the power of one divided by the number of years, then subtracts one. This produces a single, comparable annual figure that can be placed alongside any other investment — a savings account, a property, a different share — on equal footing regardless of differing holding periods.
CAGR is the standard metric used by fund managers, financial analysts, and long-term investors when presenting or evaluating multi-year performance. It smooths the noise of individual years — a strong year followed by a weak year followed by recovery — into a steady average that captures the underlying trajectory. Its limitation is the flip side of that smoothing: CAGR says nothing about the volatility experienced along the way. Two investments can arrive at identical CAGRs via completely different journeys, one grinding steadily upward and the other lurching through savage drawdowns before recovering. The CAGR figure alone cannot distinguish between them. For a complete picture, CAGR must be read alongside a measure of the risk taken to generate it.
As a working rule: use absolute return when assessing trades or investments held for one year or less, and use CAGR when comparing performance across multiple years or between investments of different durations.
Chart
Same Destination, Different Journey
Portfolio value of two hypothetical £10,000 investments — identical CAGR of 8.4% p.a. over five years, very different annual paths
Steady growth
Volatile path
£13,500
£12,000
£10,500
£9,000
Start (Both)
£10,000
End (Both)
£14,970
Absolute Return
49.7%
CAGR (Both)
8.4% p.a.
Volatile Peak (Y2)
£14,500
Volatile Trough (Y4)
£11,500
Both portfolios arrive at £14,970 after five years. CAGR reports 8.4% for each — but the volatile path swung from £14,500 to £11,500 and back, a journey the headline figure cannot show.
Return Calculation Quick Reference
Absolute Return
Best for: holdings of one year or less
( Exit ÷ Entry − 1 ) × 100
Example: Buy 300p, sell 352p
= 17.3%
CAGR
Best for: multi-year, cross-investment comparisons
( Exit ÷ Entry )^(1÷n) − 1
Example: Same trade held 2 years
= 8.4% per year
CAGR smooths out the journey. Two investments with identical CAGRs may have followed very different paths to arrive at the same result. Always consider volatility alongside the headline growth figure.
Finding Your Place in the Market
Every participant brings a different combination of capital, time, temperament, and objective to the market. The most useful framework for understanding where a participant fits is the distinction between trading and investing — not as moral categories, but as genuine differences in approach, time horizon, and the type of edge being sought.
The Trader’s Approach
A trader is a participant whose primary goal is to identify short-term price discrepancies or momentum and extract a profit from them before exiting. The holding period can range from seconds to several weeks, but the defining characteristic is that the trader is looking for specific, near-term price behaviour — not a long-term thesis about a company’s value. Traders tend to be unbiased about direction: they are as comfortable selling short, profiting from falling prices, as they are buying in anticipation of a rise. Their decisions are often driven more by price action, volume, and market structure than by fundamental analysis of the underlying business.
Within trading, several distinct styles have evolved based on holding period and risk tolerance. The day trader opens and closes all positions within the same session, carrying no overnight exposure. This eliminates the risk of unexpected news or events affecting positions while markets are closed, but it demands intense focus and rapid decision-making throughout the trading day. The scalper operates at an even finer granularity, holding positions for seconds or minutes and targeting very small price increments across large numbers of shares. The scale of position required to generate meaningful profit from tiny moves means the scalper operates with particularly tight risk management. The swing trader, by contrast, accepts overnight and sometimes multi-week exposure in exchange for the potential to capture larger directional moves — holding through the short-term noise to reach a target that a day trader would never have the patience to wait for.
Among the most celebrated traders in history, names such as George Soros — whose directional macro trades against entire currencies became legendary — and Paul Tudor Jones, known for anticipating the 1987 market crash, illustrate the diversity of approach that can be classified under the single umbrella of trading. What they share is not a style but a discipline: defined risk, consistent process, and a willingness to act without attachment.
The Investor’s Approach
An investor takes a fundamentally different orientation. Rather than seeking to profit from short-term price movements, the investor is attempting to identify businesses whose intrinsic value exceeds the current market price, or whose future growth will reward patient ownership over years or decades. The holding period is measured in years; the analysis is rooted in earnings, competitive position, management quality, and long-term industry dynamics rather than in technical price patterns.
Growth investors concentrate on identifying companies operating in markets where the structural tailwinds are strong enough to drive above-average earnings expansion for an extended period. The early investors in companies that became synonymous with technological transformation — whether in the personal computing era of the 1980s or the internet era of the 1990s — were rewarded not because they timed a trade well but because they identified the direction of a structural shift and held their conviction through the inevitable periods of doubt and volatility.
Value investors follow a different path, searching for companies whose share prices have fallen significantly below what a dispassionate analysis of the underlying business would suggest they are worth. The fall may be the result of a temporary setback, negative sentiment that has overshot rational bounds, or simple neglect by a market focused on more exciting sectors. The value investor’s edge is patience and analytical rigour — the willingness to hold an out-of-favour position until the market eventually recognises what the investor identified earlier.
The investors most associated with this discipline — Benjamin Graham, who codified its principles; Warren Buffett, who extended them to encompass the quality of the business as much as the cheapness of its price; and Charlie Munger, whose influence on Buffett’s evolution from pure value to quality-at-a-fair-price was profound — all share a common conviction. Over the long run, owning excellent businesses purchased at sensible prices, and holding them through the inevitable turbulence of markets, is one of the most reliable paths to compounding wealth. Buffett’s answer to the question of his preferred holding period — forever — was not flippancy but philosophy.
Day Trader
Opens and closes all positions within the same trading session. Carries no overnight exposure. Relies on intraday price action and volume for entry and exit decisions. Requires significant focus and rapid execution.
Scalper
Holds positions for seconds to minutes, targeting small price increments across large position sizes. Extremely risk-averse on a per-trade basis. High frequency of transactions means small edges must be replicated consistently throughout the session.
Swing Trader
Holds positions from a few days to several weeks. Accepts overnight and weekend risk in exchange for the potential to capture larger directional moves. Typically uses a blend of technical and fundamental analysis.
Growth Investor
Identifies companies operating in industries with strong structural tailwinds. Expects above-average earnings growth over multiple years. Willing to pay a premium valuation today in exchange for anticipated future compounding.
Value Investor
Searches for companies whose share prices have fallen below intrinsic worth due to temporary setbacks or market misperception. The edge is patience and rigorous analysis, waiting for the market to close the gap between price and value.
Putting the Framework to Work
The concepts covered in this article — price discovery, trade execution, settlement, returns measurement, and participant classification — are not abstract theory. They are the operating mechanics of the market that every participant navigates, consciously or not, every time they place a trade or hold an investment through earnings season. Understanding them clearly creates a significant practical advantage.
On the matter of settlement, for example: knowing that most UK equity trades now settle on a T+1 basis means understanding precisely when funds will be available after a sale and when shares will arrive in an account after a purchase. It also means understanding the dividend calendar with precision — a share purchased on the ex-dividend date will not settle in time to qualify, and the dividend will be paid to whoever held the position the day before. These details seem administrative until they produce an unexpected outcome.
On returns measurement: the temptation to celebrate absolute returns without reference to time can lead to serious analytical errors. A trade that generated 20 percent sounds excellent until it is revealed that the position was held for three and a half years — an annualised return of roughly 5.4 percent, which in many periods would have been exceeded simply by holding an index fund. Always annualise. Always compare like with like. CAGR is the honest metric; absolute return, unaccompanied by a time frame, is a figure that flatters.
On participant type: traders and investors are not in competition with each other. They occupy different time horizons and are, in many respects, providing a service to each other. The liquidity that traders generate — the constant buying and selling that keeps bid–ask spreads narrow and execution instant — benefits investors who need to build or exit positions efficiently. The long-term capital that investors commit provides stability to share prices that traders can work around. The question of which category a participant belongs to is not one of superiority but of honest self-assessment: what is my realistic time horizon? What is my true risk tolerance? What is the nature of my edge?
These are not questions to be answered once and filed away. Markets change, personal circumstances change, and an approach that served well in one environment can become counterproductive in another. The participants who endure in markets across years and decades are not necessarily the cleverest or the most aggressive. They are, more often than not, the ones who have understood the mechanics well enough to navigate the inevitable surprises — and who know, with hard-won clarity, exactly where they fit.
Bank of England Beginner bond yields Brent Crude Candlestick Charts Candlestick Patterns Charles Dow Chart Reading Commodities FCA FCA regulation fixed income FTSE 100 Fundamental Analysis gilt yields inflation interest rates ISA ISA Investing London Stock Exchange market psychology market trends OHLC price action retail investing retail trading Risk Management SIPP Sterling stocks and shares ISA Stop Loss support and resistance Swing Trading Technical Analysis Trading Basics trading education trading for beginners trading indicators Trading Signals Trading Strategy trend following trend reversal UK gilts US Treasuries yield curve



