The Candlestick Trading Series
Single Candle Patterns Part One: Marubozu, Spinning Tops, and the Doji
Three single-candle formations that tell entirely different stories — from absolute conviction to complete indecision — and why every serious trader needs to recognise them on sight.

The Japanese word marubozu translates roughly as “bald” or “shaved head.” It describes a candlestick with nothing on top and nothing below — no upper wick, no lower shadow, just a single unbroken body stretching from open to close. In the vocabulary of candlestick analysis, it is about as emphatic a statement as the market can make. One side won completely. The other side never stood a chance.
Contrast that with the doji, where the open and close are so close together that the candle has almost no body at all. The session saw action — sometimes dramatic action — but by the time the closing bell sounded, price had returned almost exactly to where it began. The market spoke for an entire session and said nothing definitive. Both buyer and seller tried their best, and neither prevailed.
Between these two extremes sits the spinning top: a candle with a small body and long wicks reaching in both directions. Not quite as decisive as the marubozu, not quite as deadlocked as the doji. Something happened, the balance was tested, and neither side held firm — but one side did at least close slightly ahead.
These three patterns are where the study of individual candlesticks properly begins. They are the building blocks, the ABC of single-candle reading. Understanding what each one is communicating about market psychology — really understanding it, not just memorising a definition — is what separates a trader who reacts to charts from one who reads them.
Conviction, Hesitation, and the Language of a Single Session
Before examining the patterns individually, it helps to understand the framework through which every candlestick pattern should be interpreted. Three rules apply to all of them, and they are worth stating clearly at the outset, because experienced traders apply them automatically while newer traders often skip past them.
The first rule is to buy strength and sell weakness. This may sound obvious, but it carries a specific meaning in candlestick trading. A bullish pattern is a signal to buy; it is not a polite suggestion to consider buying at some point. When the pattern forms and the conditions are right, the response should be decisive. Equally, a bearish signal is a signal to sell, not a prompt to wonder whether conditions might improve. The patterns themselves represent moments of strength or weakness crystallising on the chart, and a trader who hesitates to act on them misses the point of reading them in the first place.
The second rule is to be flexible about what constitutes a valid pattern. Textbook examples show perfectly formed candles with clean geometries and precise proportions. Real markets rarely deliver those. A marubozu with a tiny stub of a wick is still a marubozu in spirit. A doji where the open and close are not identical but are separated by a fraction of a penny still carries the same significance. Demanding textbook perfection leads to paralysis; demanding reasonable conformity leads to consistent signals. The trader who learns to see patterns as slightly imperfect reflections of the ideal, rather than as rigid templates that must match exactly, will find far more opportunities to act.
The third rule is perhaps the most important: identify the prior trend before interpreting any pattern. A bullish reversal pattern is only meaningful if there was a prior downtrend to reverse. A bearish reversal signal carries no weight if price was already falling. Single-candle patterns do not exist in isolation — they are moments within a story, and the story matters. A doji appearing in the middle of a sideways consolidation is telling you something quite different from a doji appearing at the top of a sustained uptrend. Context is everything, and the prior trend is the context.
The Marubozu: When One Side Takes Total Control
The marubozu is the most unambiguous pattern in the candlestick repertoire. It forms when price opens at one extreme and closes at the other, with no wick or shadow in either direction. The session began, one side dominated without interruption, and the session ended with that side still completely in control. There was no moment during the entire period when the opposing force managed to push price back even fractionally. That is a remarkable statement about sentiment.
A bullish marubozu is a green (or white) candle where the open is the low of the session and the close is the high. Buyers were in control from the first trade of the day to the last. There was no dip to buy, no retracement to exploit — price simply moved upward throughout. The absence of a lower shadow tells you that sellers never managed to push price below the opening level. The absence of an upper shadow tells you that buyers were still strong enough at the close to hold price at the session’s high. No late-session profit-taking. No late-session resistance. Just sustained, uninterrupted demand.
A bearish marubozu is the mirror image: a red (or black) candle where the open is the high and the close is the low. Sellers controlled the session from start to finish. There was no bounce, no recovery attempt that held, no moment of buyer conviction sufficient to reverse the direction even temporarily. The market opened and fell, and fell further, and closed at the bottom. This is a session of pure, unrelenting selling pressure.
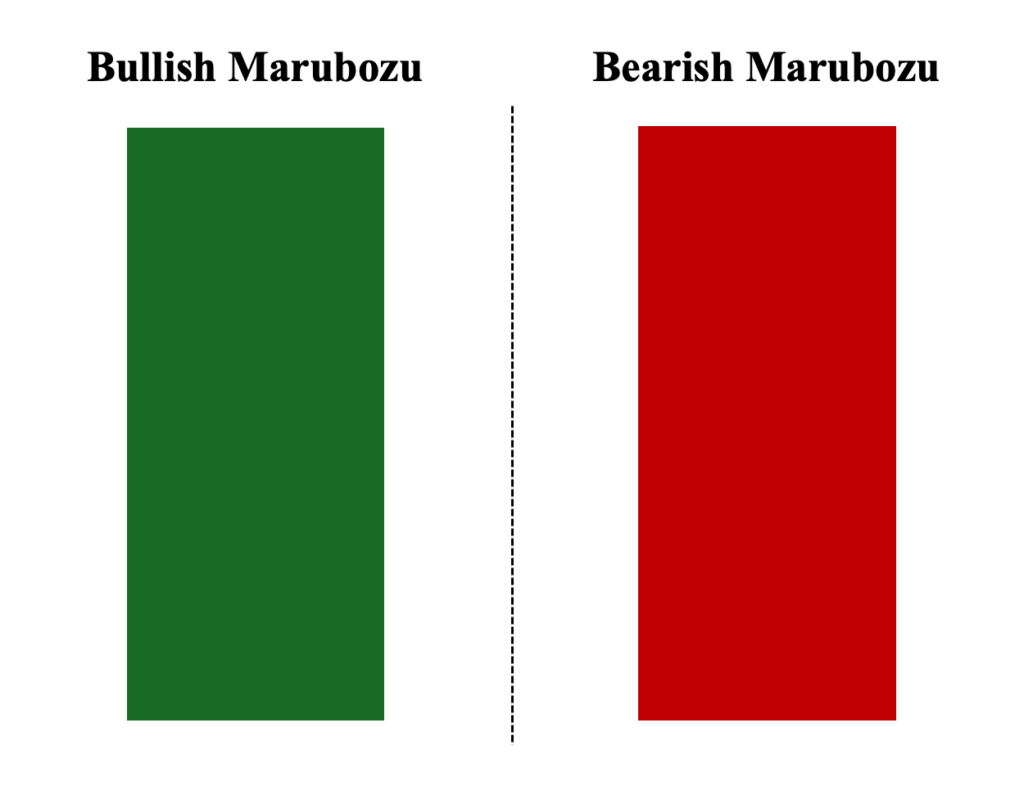
The signal each type of marubozu generates depends on where it appears in the trend. This is where the prior trend rule becomes critical.
A bullish marubozu appearing after a sustained downtrend is a potential reversal signal. It suggests that the selling pressure that drove the downtrend has been overwhelmed, at least in this session, by determined buying. The buyers did not just nibble at a dip — they took complete control and held it for the entire session. That is a meaningful shift in the balance of power. The appropriate response, once this signal is confirmed, is to enter a long position at the close of the marubozu candle. The stop loss should be placed at the low of the candle — which, given the absence of a lower wick, is also the opening price. If the pattern is valid, the low should not be revisited.
A bullish marubozu appearing in the middle of an existing uptrend carries a different meaning. Rather than a reversal signal, it acts as a continuation signal — confirmation that the trend is still intact, that the dominant force of buyers remains strong, and that the trend is likely to extend further. In this context, the pattern offers a momentum entry opportunity for traders who want to participate in a trend they may have entered late or missed entirely.
The logic for the bearish marubozu runs in parallel. Appearing at the top of an uptrend, it signals a potential reversal — a sudden and decisive shift from buying dominance to selling dominance. Appearing within an existing downtrend, it signals continuation. In both cases, the stop loss for a short trade sits at the high of the candle, which is also the open, and the entry is at or near the candle’s close.
“The marubozu does not hedge. It does not suggest. It declares. And that unambiguous declaration is precisely what makes it one of the most powerful single-candle patterns in technical analysis.”
One practical note worth emphasising: the length of the marubozu body matters. A long, full-bodied candle speaks with authority. A very short-bodied candle — even a technically valid one with no wicks — may simply reflect a quiet session with low range rather than genuine directional conviction. As a rule, the larger the body relative to the recent average candle range, the more significant the marubozu. A monster green candle with no shadows on a high-volume day is one of the most bullish signals a chart can produce. A tiny green stub with no shadows on a low-volume afternoon carries considerably less weight.
Volume, where available, provides valuable confirmation. A marubozu accompanied by significantly above-average volume tells you that the conviction behind the move was broad — that a large number of market participants agreed on direction and acted decisively in that direction. Volume below the average makes the pattern worth noting but somewhat less reliable as a standalone signal.
The Spinning Top: A Market Pausing to Think
If the marubozu is the market speaking with complete clarity, the spinning top is the market speaking with a stammer. It has small body — the open and close are relatively close together, regardless of which is higher — and long wicks extending both above and below. The session saw genuine action in both directions, but by the time the period closed, neither side had established any meaningful advantage.
The key structural requirement for a spinning top is proportionality. The wicks should be long relative to the body — ideally at least twice the length of the body on each side — and roughly symmetrical. This symmetry is important because it confirms that the battle was genuinely balanced: buyers pushed price up to the high, sellers pushed it back down to the low, and the close settled somewhere near the middle of that range. The colour of the body — whether green or red — is largely irrelevant. A spinning top is a spinning top regardless of whether the close was marginally above or marginally below the open.
— INSERT IMAGE BLOCK HERE —
Image: Diagram of a spinning top candlestick showing small central body, long upper wick, and long lower wick, with annotations for open, high, low, and close.
What does this structure tell a trader? At its core, it tells them that the momentum which characterised the previous candles — or the previous trend — is beginning to falter. Neither bulls nor bears could sustain a directional move throughout the session. The bulls tried (the upper wick shows buyers pushed price higher), the bears countered (the lower wick shows sellers pushed price back down), and both attempts ultimately failed to hold. The session closed near its starting point, having been to both extremes and returned.
The spinning top is a pattern of indecision, and indecision at key moments is a valuable signal. When it appears after a sustained uptrend, it suggests that the buyers who drove the trend higher are losing their conviction. They are still buying — hence the upper wick — but the sellers are matching them with enough force to pull price back. The dominant force is weakening. The trend may not reverse immediately, but the conditions that allowed it to continue uninterrupted are changing.
The same logic applies at the bottom of a downtrend. A spinning top appearing after a prolonged fall signals that sellers are losing the monopoly on direction they previously enjoyed. Buyers are testing the downside lows and finding support. The balance is shifting, if only marginally, toward equilibrium.
Critically, the spinning top does not give a directional signal by itself. It is a warning, not a trigger. The pattern requires confirmation from the candle that follows it. In a downtrend, if a spinning top appears and the next candle is a strong bullish candle, the combination suggests that the downtrend may be reversing and a long position can be considered. If instead the next candle is bearish, the downtrend is likely continuing. The spinning top simply flags the moment of uncertainty; the subsequent price action resolves it.
How to Qualify a Spinning Top
Not every small-bodied candle with wicks is a meaningful spinning top. For the pattern to carry analytical weight, it should meet these conditions:
Small body: The distance between open and close should represent no more than around one-third of the total candle range (high to low). A body that fills half the range or more starts to resemble a directional candle rather than an indecision signal.
Long wicks: Both the upper and lower shadows should be clearly visible and ideally at least twice the length of the body. Very short wicks reduce the sense of balanced battle that gives the pattern its meaning.
Symmetry: The upper and lower wicks should be broadly similar in length. If one wick is dramatically longer than the other, the candle may be starting to take the shape of a different pattern — potentially a hammer or shooting star — with a different interpretation.
Context: The pattern is only meaningful after a directional move. A spinning top in the middle of a sideways, choppy market is simply confirming what you already know — that the market is going nowhere.
In practice, spinning tops appear with some frequency, particularly on shorter time frames or during quieter trading periods. This frequency means they should not be traded mechanically. The trader who buys or sells every spinning top as though it were a guaranteed reversal signal will be disappointed. The pattern’s value lies in what it represents — a moment of genuine uncertainty at a potentially significant point in a trend — and it must be read in that spirit.
Where spinning tops carry most weight is at support or resistance levels. If a sustained uptrend brings price to a major resistance zone, and a spinning top forms at precisely that level, the combination of structural resistance and candlestick indecision is a powerful warning that the trend may be running out of energy. Similarly, at a significant support level following a downtrend, a spinning top can mark the moment when selling pressure finally encounters genuine buyer interest. In both cases, the spinning top alone does not confirm the trade — but it focuses attention on a level worth watching closely.
The Doji: Perfect Equilibrium and What It Means
The doji is, in some ways, the spinning top taken to its logical extreme. Where the spinning top has a small body, the doji has almost none at all — the open and close are virtually identical, leaving only a horizontal line where the candle body would normally be. Wicks may extend in either direction, but the defining characteristic is that crosslike or plus-sign shape where the body has effectively disappeared.
The name comes from the Japanese, and it carries connotations of simultaneously having the same price for open and close — a state of perfect balance, at least at that moment. In market terms, the doji represents a session where buying and selling pressure were so precisely matched that all the activity of the period cancelled itself out. Price went somewhere during the session, sometimes quite far, but it returned to exactly — or almost exactly — where it started.
The significance of the doji depends heavily on where it appears. On its own, in any random position on a chart, a doji is a neutral observation. It becomes important when it appears at the end of a trend, because it suggests that the energy which sustained that trend has momentarily reached equilibrium. The trend is not necessarily over, but it is pausing, and that pause at a critical juncture is worth paying close attention to.
— INSERT IMAGE BLOCK HERE —
Image: Four doji types displayed side by side — standard doji (cross shape), long-legged doji (extended wicks both directions), gravestone doji (long upper wick, no lower wick), dragonfly doji (long lower wick, no upper wick) — with labels for each type.
There are four main variants of the doji, each with a slightly different structure and a slightly different nuance of meaning.
The Standard Doji
The standard, or classic, doji has a small or absent body with wicks extending in both directions. It is the most common form. Its interpretation is context-dependent: at the peak of an uptrend, it warns that buyers are losing their grip; at the bottom of a downtrend, it warns that sellers may be exhausting themselves. The standard doji is the most ambiguous of the four types because the roughly balanced wicks give no particular directional lean — it simply marks a moment of equilibrium.
The Long-Legged Doji
The long-legged doji has the same crosslike body as the standard doji, but with much longer wicks extending both above and below. This extended range tells a more dramatic story: during this session, price travelled a significant distance in both directions, buyers and sellers engaged in a fierce battle across a wide range, and yet neither side held any advantage by the close. The long-legged doji is a particularly emphatic indecision signal. The session was not quiet — it was volatile and contested — and the fact that it resolved to almost exactly where it began despite that volatility underlines the depth of the uncertainty.
The Gravestone Doji
The gravestone doji has a long upper wick and little or no lower wick. The open, the close, and the low are all at approximately the same level, while the high is significantly above them. During the session, buyers pushed price upward — sometimes substantially — but sellers drove it all the way back down by the close, erasing every gain. The name is somewhat grim, and appropriately so: the gravestone doji appearing at the top of an uptrend is one of the more bearish single-candle signals available. It shows buyers attempting and failing to sustain the upward momentum. Whatever ground they gained during the session, they could not hold it. This is a strong warning of a potential reversal downward.
The Dragonfly Doji
The dragonfly doji is the mirror image of the gravestone. It has a long lower wick and little or no upper wick. The open, close, and high are all at approximately the same level, while the session low is significantly below them. During the period, sellers pushed price lower — testing support, probing for weakness — but buyers drove it all the way back up to the opening level by the close. This is a bullish signal, particularly powerful when it appears at the bottom of a downtrend. It shows that sellers attempted to extend the decline and failed. Buyers stepped in with sufficient conviction to recover all losses within the same session. The low of the dragonfly becomes a meaningful support level, because it represents the exact point at which aggressive buying emerged.
“The gravestone doji and the dragonfly doji tell opposite stories with the same structure. One shows buyers failing at the top; the other shows sellers failing at the bottom. Both are among the more reliable single-candle signals a chart can produce.”
All four doji types share one important characteristic: they are signals of potential change, not confirmation of it. A doji at the top of an uptrend does not guarantee that the trend is over — it suggests that the energy behind the trend has momentarily reached a point of balance, and that the next few candles will be decisive. As with the spinning top, the candle that follows the doji is critical. A strong bearish candle following a doji at the peak of an uptrend confirms the reversal signal. A strong bullish candle following a doji at the peak of an uptrend suggests the trend has resumed and the doji was merely a pause.
Putting the Three Patterns Into Practice
The marubozu, the spinning top, and the doji form a natural triad. They represent the three states a market can occupy at any given moment: absolute conviction (marubozu), contested balance (spinning top), and perfect equilibrium (doji). Learning to identify which state the market is in — and what typically follows each state in context — gives a trader a significant interpretive edge over someone simply watching price move.
In practice, these three pattern types are used differently in a trading strategy, and it is worth being explicit about those differences.
The marubozu is an actionable signal. When a bullish marubozu forms at the end of a downtrend, the entry point is at the close of that candle, or on the open of the following session. The stop loss sits at the low of the marubozu body. This is the prior trend rule applied directly: a downtrend has been in progress, a signal of reversal has appeared, the appropriate action is to take a long position with a clearly defined exit if the signal proves false. The same logic, inverted, applies to the bearish marubozu at the top of an uptrend.
The spinning top and the doji are signals that require a second step before action. They tell you to pay attention and wait, not to act immediately. The appropriate response to either pattern at a significant trend extreme is to mark the high and low of that candle, watch the next session carefully, and prepare for a directional move. If that next candle is strongly directional in a way that suggests reversal, the trade can be entered. If it is not conclusive, patience is the right response.
Bullish Marubozu
Forms after a downtrend. No upper or lower wick. Entry at candle close; stop loss at the low (which equals the open). A momentum continuation signal when appearing within an existing uptrend.
Bearish Marubozu
Forms after an uptrend. No upper or lower wick. Entry at candle close; stop loss at the high (which equals the open). A momentum continuation signal when appearing within an existing downtrend.
Spinning Top
Small body, long equal wicks in both directions. Signals weakening momentum. Requires confirmation from the next candle before acting. Most meaningful at support or resistance levels following a clear trend.
Doji Family
Open and close almost identical. Variant shapes (gravestone, dragonfly, long-legged) carry directional nuances. Always requires next-candle confirmation. Most significant at trend extremes or key price levels.
A question traders often ask is how to handle these patterns when they appear in the middle of a trend rather than at an extreme. A spinning top forming five candles into a young uptrend, for instance — is that worth acting on? The short answer is usually no. These patterns draw their significance from context. A moment of indecision at a critical juncture — a long-term resistance level, the end of a prolonged trend, a major pivot high or low — is meaningful because it occurs where the stakes are highest. The same candle appearing mid-trend, where there is no obvious structural reason for the indecision, is likely noise rather than signal. Experienced traders learn to filter for context as rigorously as they watch for pattern structure.
It is also worth noting that these three patterns are not mutually exclusive in their information content. A session that opens strongly in one direction, fails to sustain the move, and closes near the open is telling a story about exhaustion. Whether that candle is classified technically as a spinning top or a doji matters less than the underlying narrative it represents: conviction attempted, conviction failed, balance restored. The classifications are useful because they create a shared vocabulary and a framework for analysis, but the underlying principle — that each candle is a compressed record of a battle between buyers and sellers — is more important than any individual label.
The three patterns examined in this article are among the simplest in the candlestick repertoire. They are single-candle formations with no complex multi-period sequencing to track. And yet they contain, in compact form, the essential logic that underlies every more complex pattern that follows. Once a trader genuinely understands why a marubozu signals what it signals, why a spinning top warrants caution, and why a doji at the top of a trend deserves close attention, they are ready for the more nuanced signals that two-candle and three-candle patterns provide. Those will be explored in the articles that follow. For now, the foundation is what matters — and it is solid.



